- Templates |
- Critical Path Example
Critical path Gantt chart example
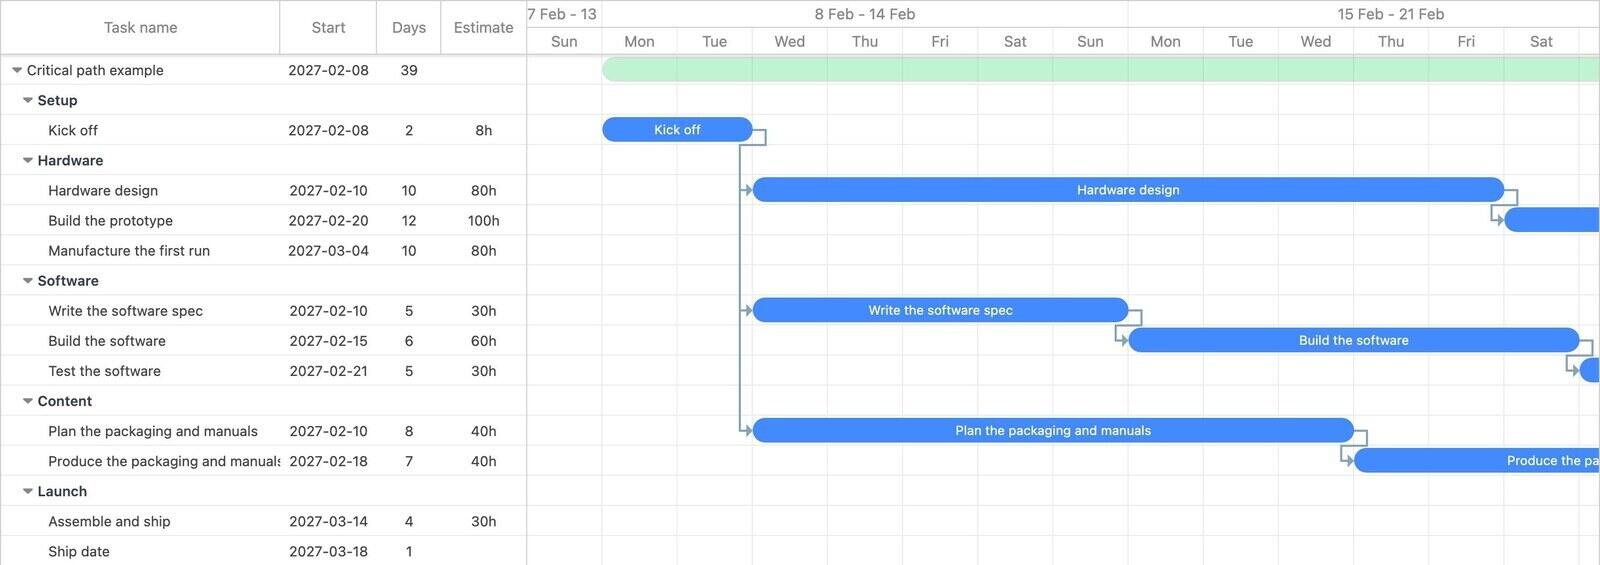
A deliberately small chart built to show one thing clearly: three parallel tracks of very different lengths converging on a single ship date, so you can see which one controls the deadline and how much slack the other two have.
- 5 phases
- 10 tasks
- 1 milestone
- 12 dependencies
- About 6 weeks
Three tracks, one deadline
After a two-day kick-off, three tracks run in parallel and all three have to finish before assembly can start:
| Track | Length | Float |
|---|---|---|
| Hardware | 32 days (design 10, prototype 12, manufacture 10) | None — this is the critical path |
| Software | 16 days (spec 5, build 6, test 5) | 16 days |
| Content | 15 days (plan 8, produce 7) | 17 days |
The hardware track is twice as long as either of the others, so it alone decides the ship date. Every day it slips, the project slips. The software and content tracks can each run more than two weeks late and change nothing.
Why this matters more than it sounds
The practical consequence is about where you put attention and money. Adding a person to the software track in this project buys you nothing — that track already finishes sixteen days early. Adding one to hardware design shortens the whole project.
It also changes what you escalate. A three-day slip on content is noise. A three-day slip on the prototype is a three-day slip on the ship date, and it is worth interrupting someone about.
Most projects that "suddenly" run late were late on the critical path for weeks while everyone watched a task with float.
Seeing it in the chart
Copy the template into your account and turn on Critical path under Settings in the chart toolbar. The zero-float tasks are highlighted, and the highlight recalculates as you drag bars.
That last part is the useful bit. Drag the software test task fifteen days later and nothing changes. Drag it twenty days later and the critical path jumps to the software track — the constraint has moved, and the chart tells you before the deadline does.
Using it on real work
This template is a teaching example rather than a plan to run a project from, but the structure transfers directly. Any project with parallel workstreams converging on a launch has the same shape: find the longest chain, watch it, and stop worrying quite so much about the rest.
Gantt chart dependencies covers which tasks are actually worth linking, which is what makes a critical path calculation meaningful in the first place.
Common questions
What is the critical path?
The longest chain of dependent tasks through a project. Its length is the shortest possible duration of the whole project.
What is float?
How long a task can slip before it affects the end date. Critical path tasks have zero float; here the software track has sixteen days and content seventeen.
How do I see the critical path in Ganttile?
Copy the template, then turn on Critical path under Settings in the chart toolbar.
Can the critical path change?
Yes, and that is the point of watching it. If software slipped more than sixteen days it would become critical instead of hardware.
 Breeze
 Timen
Timen


